
Introduction
Until now, you have been working with a single cleaned dataset.
But in real-world projects, data is always split across multiple tables and files.
Looking at your current dataset:
You already have:
Sales_Data
Product_Master
But in real scenarios:
Monthly sales come in separate files
Product details are stored separately
Without combining them, your analysis will always be incomplete.
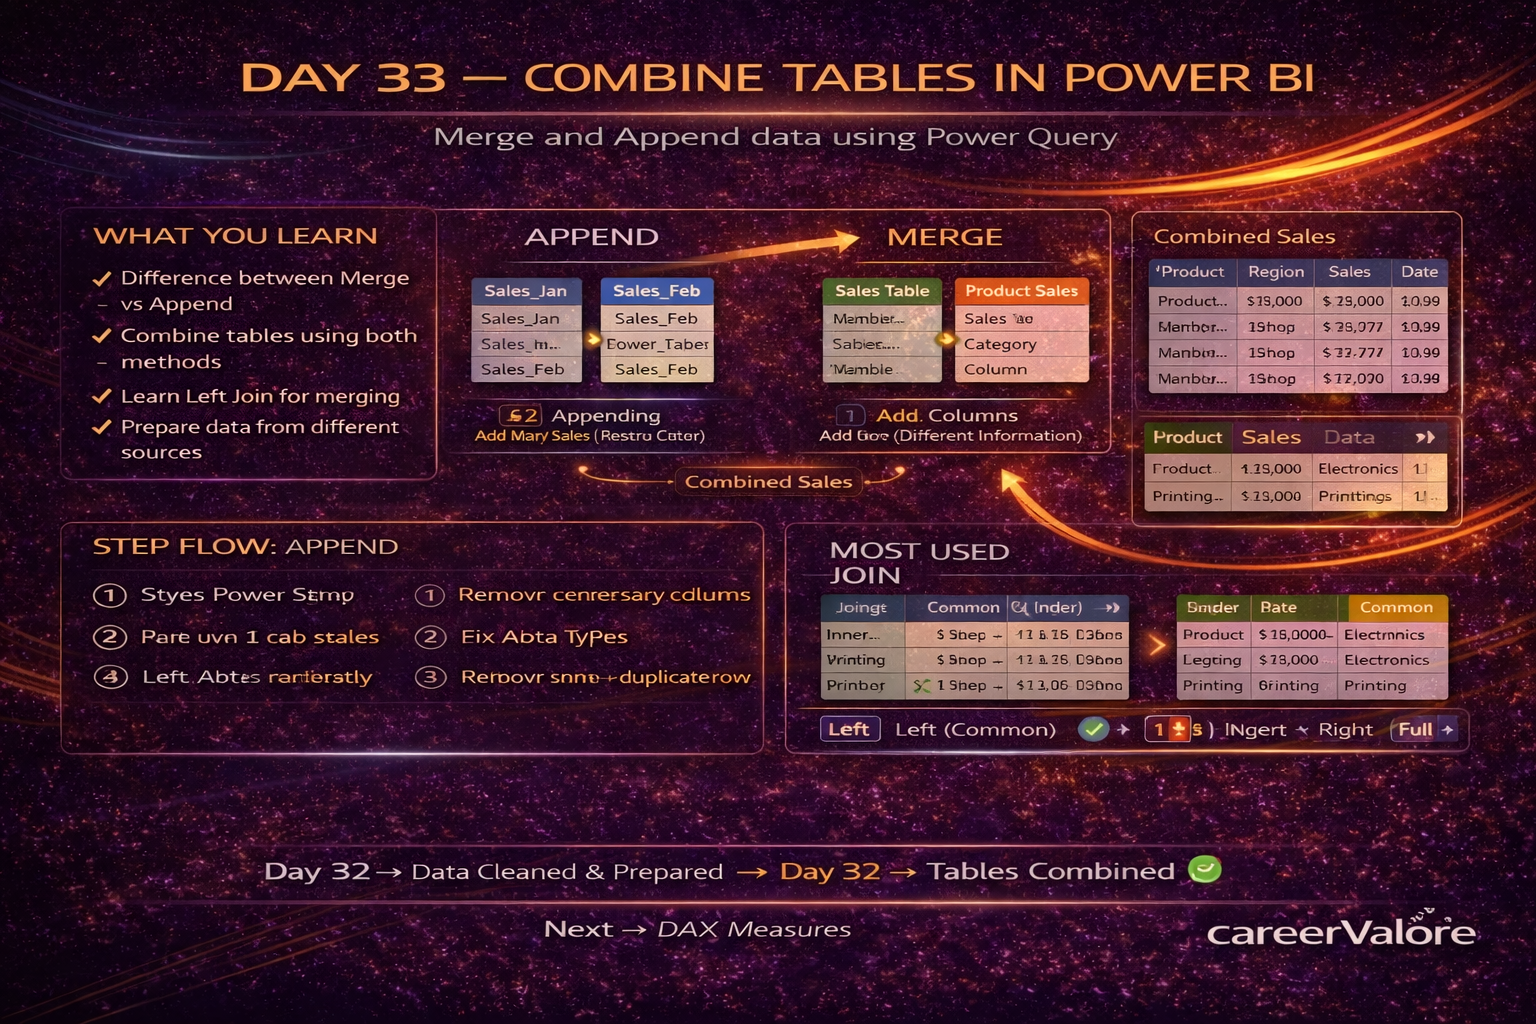
In Day 33, you will learn how to combine your actual data using Merge and Append — just like real business workflows.
What You Will Learn Today
You will simulate multiple months of data
You will combine data using Append
You will enrich data using Merge
You will prepare a complete dataset for analysis
Why This Skill Matters for Your Career
In real companies:
Data comes from multiple sources
You must:
Combine datasets
Add business context using lookup tables
Prepare final datasets for reporting
This is one of the most common real-world tasks.
Understanding the Concept in Simple Terms
Append → Add more rows (same structure)
Merge → Add more columns (extra information)
Append = stacking data
Merge = joining data
How This Connects to Previous Days
Day 32 → You cleaned your data
Day 30–31 → You built relationships
Today → You combine multiple datasets before analysis
Step-by-Step: Create Additional Monthly Data (Important Step)
Since your dataset has only one month, we will simulate another month.
Go to:
Home → Transform Data
Right-click:
Sales_Data → Duplicate
Rename it:
Sales_Data_Feb
Now modify the Date column:
Go to:
Add Column → Custom Column
Enter formula:
Date.AddMonths([Date], 1)
Click OK
Now:
Delete old Date column
Rename new column → Date
Test Checkpoint
Dates should now shift like:
January → February
Example:
05-Jan → 05-Feb
What This Means
You just created realistic next-month data
Step-by-Step: Append Tables
Go to:
Home → Append Queries → Append Queries as New
Select:
Sales_Data
Sales_Data_Feb
Click OK
Rename new table:
Combined_Sales
Test Checkpoint
Rows should increase
Both months’ data should appear together
What This Means
You combined multiple months into one dataset
Step-by-Step: Merge Tables (Using Product_Master)
Now enrich your data using Product_Master
Select:
Combined_Sales
Go to:
Home → Merge Queries
Select:
Product_Master
Match column:
Product → Product
Join Type:
Left Outer (Keep all from Combined_Sales)
Click OK
Step-by-Step: Expand Merged Data
Click expand icon
Select:
Standard Price
Click OK
Test Checkpoint
Your table should now include:
Standard Price column
What This Means
You added business context to your data
Now you can compare:
Sales vs Standard Price
Try This Yourself
Create a new column:
Profit = Sales – (Quantity * Standard Price)
Check:
Does it change correctly when filtering by Product or Region
Common Mistakes to Avoid
Using Append instead of Merge
Not shifting dates properly
Matching wrong columns
Forgetting to expand merged columns
Not validating results
What You Built Today
You created:
Multi-month dataset
Enriched dataset with pricing
This is how real-world datasets are prepared
What Comes Next
Next, you will start DAX and create measures for business calculations.
This is one of the most important skills for interviews.
Stay Connected and Keep Practicing
Blogs WhatsApp Channel (for daily quizzes and blog updates):
https://whatsapp.com/channel/0029VbCcWME4inotCWmN5511
Telegram Channel (Job Updates & Career Alerts):
https://t.me/careervalore
WhatsApp Channel (Daily Job Updates):
https://www.whatsapp.com/channel/0029Vay7sUV11ulUIhLBUI44
Conclusion
Today you worked with real-world data scenarios.
You combined datasets and enriched them with additional information.
This is exactly how professional data preparation is done.
Leave a Reply