
Introduction
In Day 33, you transformed your raw data into a proper final dataset.
You created:
Combined_Sales
This table now contains:
Product
Region
Sales
Quantity
Standard Price
Base Cost
This is your final working table.
But there is still one important thing missing.
Profit.
Without Profit, your dashboard cannot answer real business questions like:
Which product is most profitable
Which region is performing well
Are we making or losing money
In Day 34, you will first create Profit using Combined_Sales, and then build DAX measures on top of it.
What You Will Learn Today
You will create Profit column using Base Cost
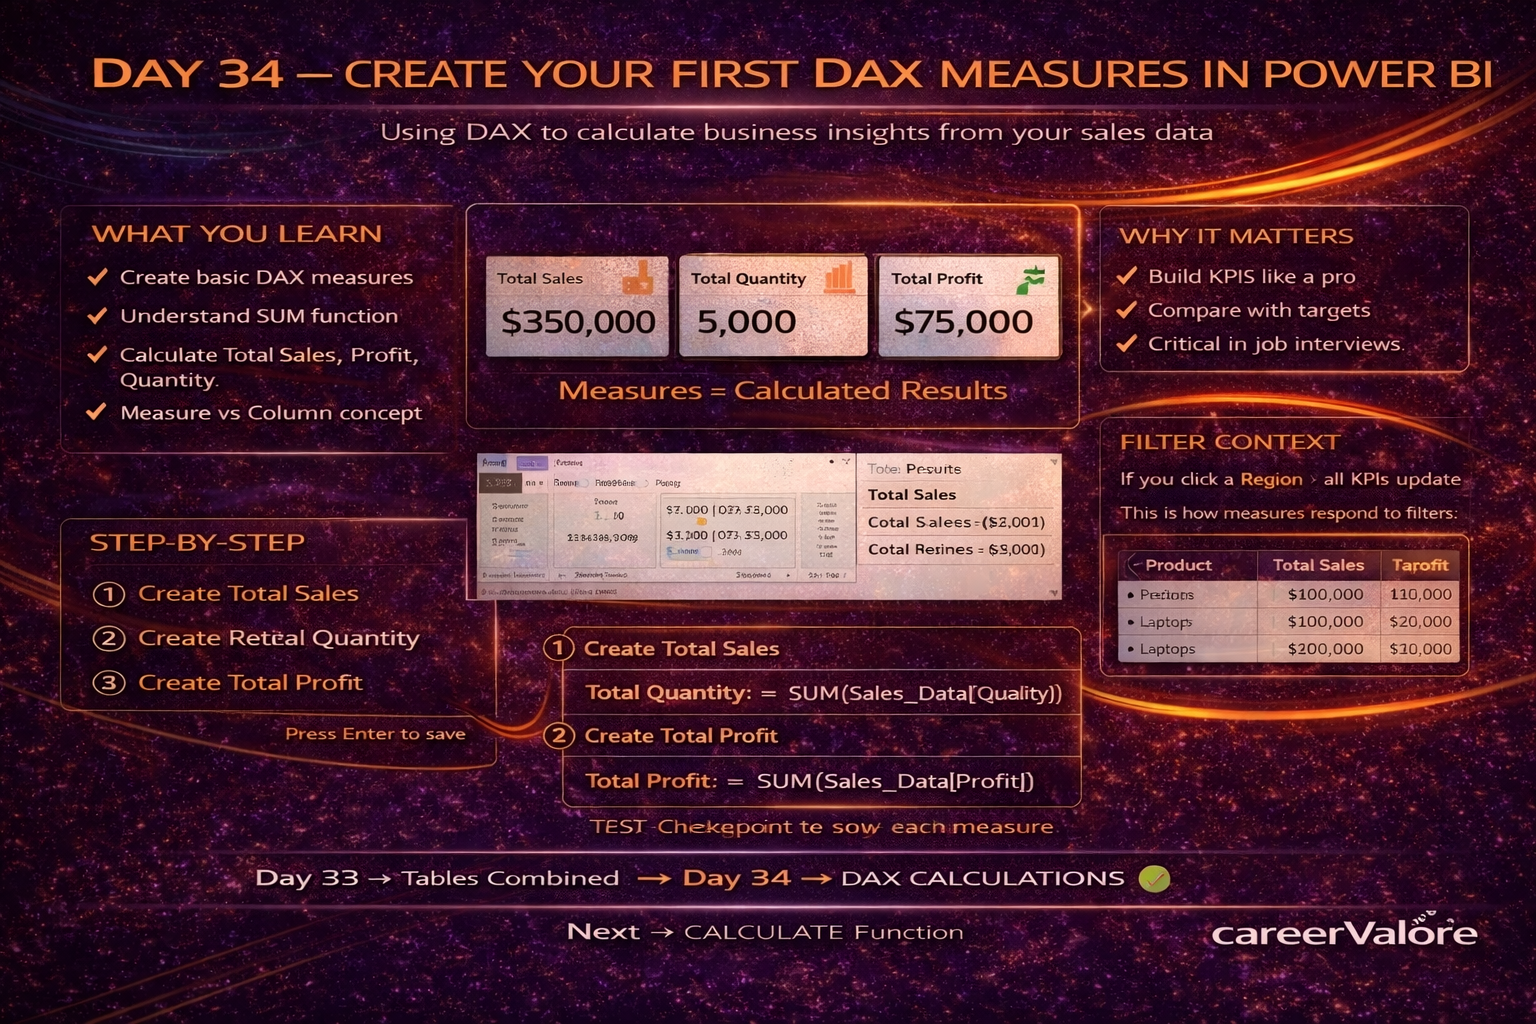
You will create Total Sales measure
You will create Total Quantity measure
You will create Total Profit measure
You will understand how measures work
Why This Skill Matters for Your Career
In real projects:
You always work on a final dataset
You must:
Create business metrics
Build KPIs
Use DAX effectively
This is one of the most important skills for interviews.
Understanding the Concept in Simple Terms
Column → stored value for each row
Measure → calculated value based on filters
So:
Profit column = row-level calculation
Total Profit = aggregated calculation
How This Connects to Previous Days
Day 33 → You created Combined_Sales
Today → You use it to build business calculations
Step-by-Step: Create Profit Column (Using Combined_Sales)
Go to:
Home → Transform Data
Select:
Combined_Sales
Go to:
Add Column → Custom Column
Enter:
Profit = [Sales] - [Base Cost]
Click OK
Then:
Close & Apply
Test Checkpoint
Pick one row:
If:
Sales = 260000
Base Cost = 250000
Then:
Profit = 10000
✔ Correct
What This Means
You now have proper profit calculation for each row
Step-by-Step: Create Total Sales Measure
Go to Report View
Right-click Combined_Sales → New Measure
Total Sales = SUM(Combined_Sales[Sales])
Test Checkpoint
Add Card visual → shows total revenue
Step-by-Step: Create Total Quantity Measure
Total Quantity = SUM(Combined_Sales[Quantity])
Step-by-Step: Create Total Profit Measure
Total Profit = SUM(Combined_Sales[Profit])
Test Checkpoint
Add Card
You should see total profit
Step-by-Step: Use Measures in Visuals
Create a table:
Add:
Product
Total Sales
Total Profit
Test Checkpoint
Values should change when filtering by:
Region
Product
Important Understanding
Measures automatically respond to filters
This is called:
Filter Context
Try This Yourself
Create:
Bar chart → Product vs Total Profit
Add Region slicer
Check:
Does profit change dynamically
Common Mistakes to Avoid
Using Sales_Data instead of Combined_Sales
Skipping Profit column creation
Using Standard Price instead of Base Cost
Not applying changes in Power Query
What You Built Today
You created:
Profit column
Total Sales measure
Total Quantity measure
Total Profit measure
These are core KPIs used in real dashboards
What Comes Next
Next, you will learn CALCULATE function — the most powerful function in DAX.
This will allow you to control filters and create advanced business logic.
Stay Connected and Keep Practicing
Blogs WhatsApp Channel (for daily quizzes and blog updates):
https://whatsapp.com/channel/0029VbCcWME4inotCWmN5511
Telegram Channel (Job Updates & Career Alerts):
https://t.me/careervalore
WhatsApp Channel (Daily Job Updates):
https://www.whatsapp.com/channel/0029Vay7sUV11ulUIhLBUI44
Conclusion
Today you built your first real business metrics using your final dataset.
Your dashboard can now show meaningful insights, not just raw data.
Leave a Reply