
Introduction
Over the past 46 days, you have learned:
Data Cleaning
Power Query
Data Modeling
Relationships
DAX Measures
CALCULATE and ALL
Time Intelligence
Dashboard Design
Publishing
Refresh Management
API Connections
Interview Concepts
Now it is time to bring everything together into one complete business project.
This project simulates a real Power BI assignment that a company might expect from a Data Analyst.
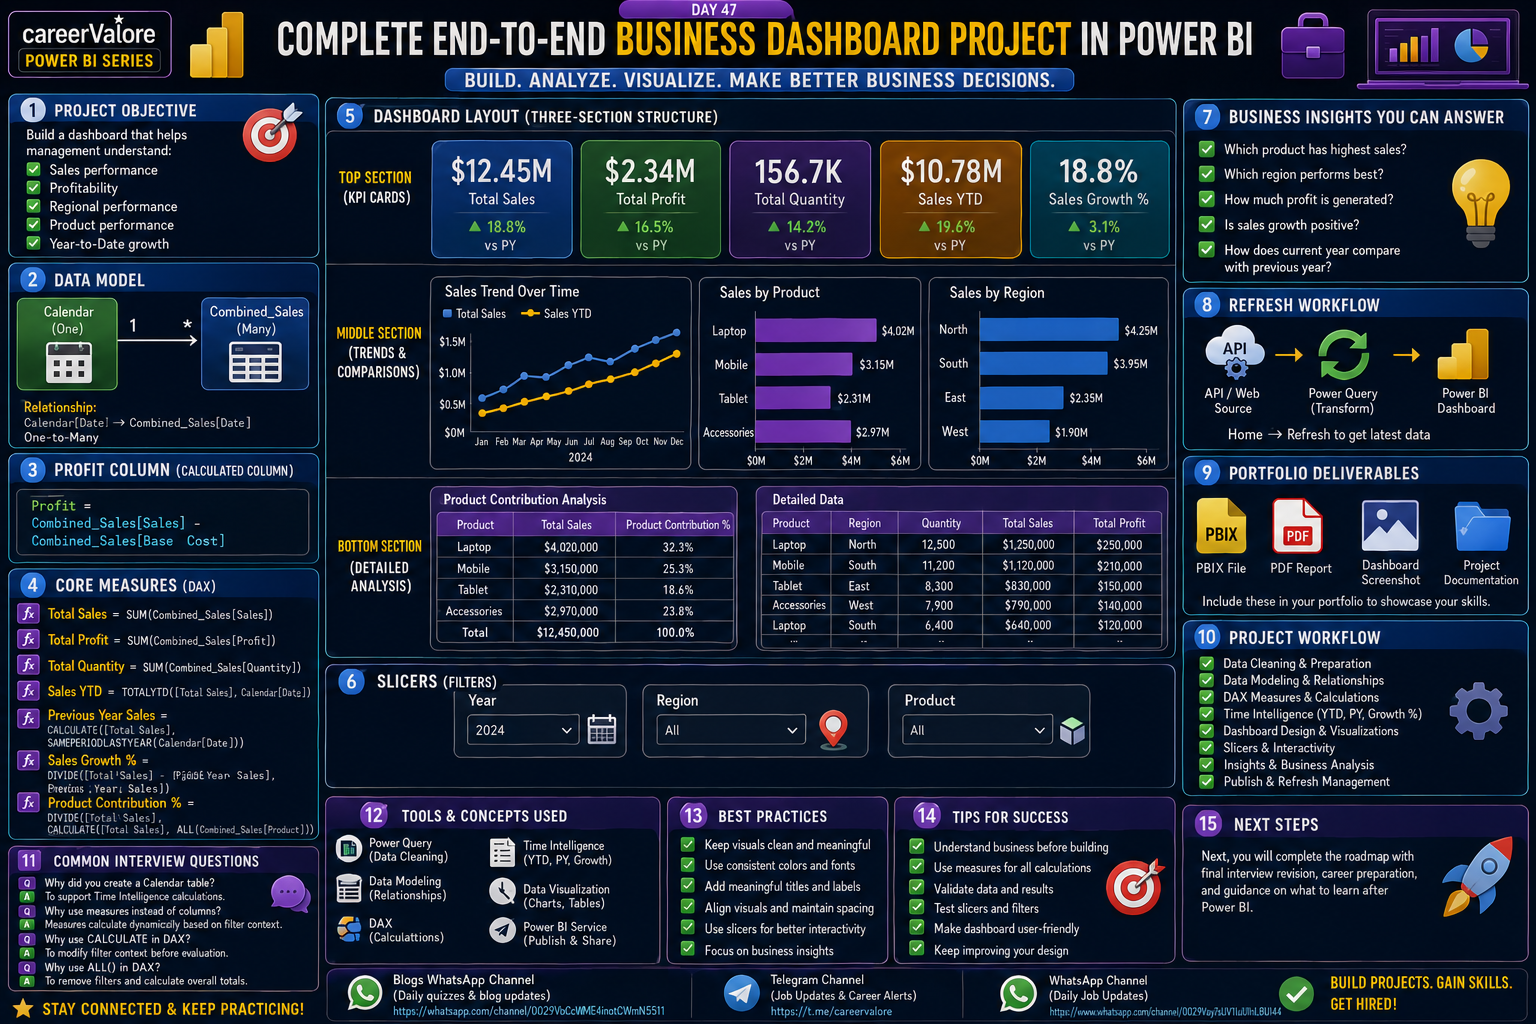
In Day 47, you will build a complete Sales Performance Dashboard using your existing Combined_Sales and Calendar tables.
What You Will Learn Today
You will build a complete business dashboard
You will apply everything learned in previous lessons
You will create a portfolio-ready project
You will practice a real-world reporting workflow
Why This Skill Matters for Your Career
Most interviews eventually ask:
“Show me a project you have worked on.”
This dashboard can become your answer.
It demonstrates:
Data preparation
DAX knowledge
Business analysis
Dashboard design
Problem-solving skills
Project Objective
Build a dashboard that helps management understand:
Sales performance
Profitability
Regional performance
Product performance
Year-to-Date growth
using Combined_Sales and Calendar.
Step 1: Verify Data Model
Ensure relationship exists:
Calendar[Date] → Combined_Sales[Date]
Relationship should be:
One-to-Many
Calendar on the One side.
Step 2: Create Required Calculated Column
Create Profit column:
Profit =Combined_Sales[Sales] -Combined_Sales[Base Cost]
This will be used in measures and visuals.
Step 3: Create Core Measures
Total Sales
Total Sales =SUM(Combined_Sales[Sales])
Total Profit
Total Profit =SUM(Combined_Sales[Profit])
Total Quantity
Total Quantity =SUM(Combined_Sales[Quantity])
Sales YTD
Sales YTD =TOTALYTD( [Total Sales], Calendar[Date])
Previous Year Sales
Previous Year Sales =CALCULATE( [Total Sales], SAMEPERIODLASTYEAR(Calendar[Date]))
Sales Growth %
Sales Growth % =DIVIDE( [Total Sales] - [Previous Year Sales], [Previous Year Sales])
Product Contribution %
Product Contribution % =DIVIDE( [Total Sales], CALCULATE( [Total Sales], ALL(Combined_Sales[Product]) ))
Step 4: Create Dashboard Layout
Use a three-section structure.
Top Section:
KPI Cards
Middle Section:
Trends and Comparisons
Bottom Section:
Detailed Analysis
This is a common business dashboard layout.
Step 5: KPI Section
Create Card visuals for:
Total Sales
Total Profit
Total Quantity
Sales YTD
Sales Growth %
Arrange cards in one row.
Use consistent spacing.
Step 6: Monthly Trend Analysis
Insert Line Chart.
Axis:
Calendar Date
Values:
Total Sales
Add:
Sales YTD
This visual shows sales trends over time.
Step 7: Product Performance Analysis
Insert Bar Chart.
Axis:
Product
Values:
Total Sales
Sort descending.
This identifies best-performing products.
Step 8: Regional Performance Analysis
Insert Clustered Bar Chart.
Axis:
Region
Values:
Total Sales
This helps compare sales across regions.
Step 9: Contribution Analysis
Insert Table.
Fields:
Product
Total Sales
Product Contribution %
Format contribution as percentage.
This shows each product’s share of overall sales.
Step 10: Detailed Data Table
Insert Table visual.
Add:
Product
Region
Quantity
Total Sales
Total Profit
This allows detailed inspection.
Step 11: Add Slicers
Create slicers for:
Year
Region
Product
These should filter all visuals.
Step 12: Test Dashboard Functionality
Check:
KPI updates
Chart updates
Table updates
Slicer interactions
Everything should respond correctly.
Step 13: Apply Professional Formatting
Follow these standards:
Consistent font sizes
Aligned visuals
Clear titles
Proper spacing
Readable layout
Avoid clutter.
Step 14: Business Insights You Should Be Able to Answer
Using your dashboard:
Which product has highest sales?
Which region performs best?
How much profit is generated?
Is sales growth positive?
How does current year compare with previous year?
These are common business questions.
Portfolio Tip
Export:
Dashboard screenshot
PBIX file
PDF report
These can be included in your portfolio.
Common Interview Questions From This Project
Question:
Why did you create a Calendar table?
Answer:
To support Time Intelligence calculations.
Question:
Why use measures?
Answer:
Measures calculate dynamically based on filter context.
Question:
Why use CALCULATE?
Answer:
To modify filter context before evaluation.
Question:
Why use ALL?
Answer:
To remove filters and calculate overall totals.
What You Learned Today
You built a complete project using:
Data modeling
DAX
Time Intelligence
Dashboard design
Business analysis
Interactivity
This project represents a complete Power BI reporting workflow.
Try This Yourself
Build the dashboard from scratch without looking at previous lessons.
If you can complete it independently, you are close to being job-ready.
What Comes Next
Next, you will complete the roadmap with final interview revision, career preparation, and guidance on what to learn after Power BI.
Stay Connected and Keep Practicing
Blogs WhatsApp Channel (for daily quizzes and blog updates):
https://whatsapp.com/channel/0029VbCcWME4inotCWmN5511
Telegram Channel (Job Updates & Career Alerts):
https://t.me/careervalore
WhatsApp Channel (Daily Job Updates):
https://www.whatsapp.com/channel/0029Vay7sUV11ulUIhLBUI44
Conclusion
Today you completed a full end-to-end Power BI business project.
This project combines almost every major concept learned throughout the roadmap and can serve as the foundation of your Power BI portfolio.
Leave a Reply