
Introduction
So far, you have built a strong foundation.
On Day 1, you imported your sales dataset.
On Day 2, you cleaned and standardized it so Power BI could trust the data.
On Day 3, you connected multiple tables using relationships.
Now you are ready for something that almost every real-world dashboard requires: analyzing data over time.
Businesses rarely ask, “What are total sales?”
They ask questions like:
- What were sales this month?
- How is this quarter performing compared to last month?
- Are we growing over time?
To answer these questions properly, Power BI needs a dedicated calendar table. Today, in Day 4, you will build that structure.
What You Will Learn Today
By the end of this session, you will be able to:
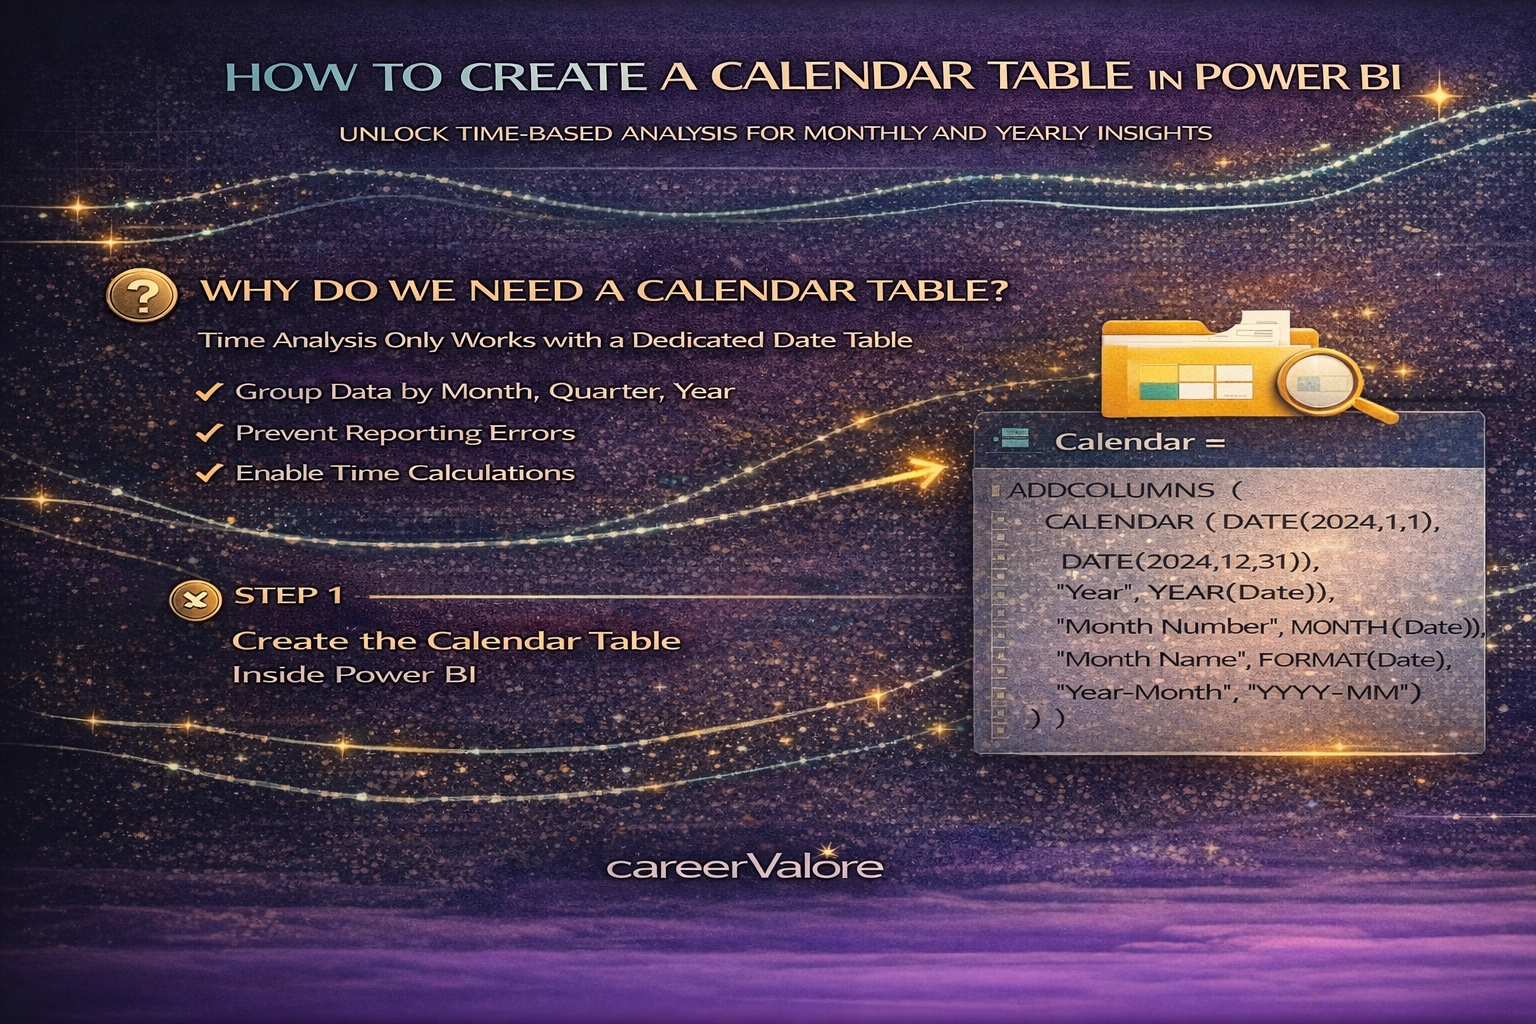
- Understand why Power BI needs a separate calendar table
- Create a Date (Calendar) table inside Power BI
- Connect it to your existing Sales_Data
- Enable time-based analysis like monthly and yearly summaries
- Prepare your model for future time intelligence calculations
Why This Skill Matters for Your Career
Many beginners try to use the date column directly from their sales table.
But professionals never rely on raw transaction dates alone.
A proper calendar table:
- Allows grouping by Month, Quarter, or Year
- Prevents reporting errors
- Supports advanced comparisons later
- Is a standard expectation in Power BI dashboards
Without a calendar table, time analysis becomes unreliable.
Understanding the Concept in Simple Terms
Imagine you are maintaining attendance records.
You don’t just store the days students came.
You maintain a full academic calendar that includes every day — even holidays.
Why?
Because analysis requires structure, not just events.
Similarly, Power BI needs a complete calendar to organize your transaction dates.
We Will Continue Using the Same Project
Open your existing Power BI file connected to:
PowerBI_Learning_Project.xlsx
We are not adding new Excel sheets today.
We will create the calendar directly inside Power BI.
Step-by-Step: Create the Calendar Table
- In Power BI, go to Modeling → New Table
- Enter this formula:
Calendar = ADDCOLUMNS ( CALENDAR (DATE(2024,1,1), DATE(2024,12,31)), "Year", YEAR([Date]), "Month Number", MONTH([Date]), "Month Name", FORMAT([Date], "MMMM"), "Year-Month", FORMAT([Date], "YYYY-MM"))
- Press Enter.
Power BI now generates a full year of dates automatically.
What This Formula Did (In Simple Language)
- CALENDAR created one row for every day in 2024
- ADDCOLUMNS added useful fields like:
- Year
- Month Name
- Month Number
- A Year-Month label for reporting
Instead of typing dates manually, Power BI built a structured timeline.
Step-by-Step: Create the Relationship
Now we must connect this Calendar to your Sales_Data.
- Go to Model View
- Drag Date from Calendar table
- Drop it onto Date in Sales_Data
You have now linked transactions to the calendar.
This allows Power BI to organize your sales chronologically.
Step-by-Step: Use the Calendar in a Visual
Go to Report View.
Create a Table Visual and add:
- Month Name (from Calendar)
- Sales (from Sales_Data)
You will now see sales grouped by month automatically.
This grouping works because Power BI is using the Calendar table — not the raw transaction dates.
Important Concept You Just Learned
You now have a proper analytical model:
- Sales_Data → stores transactions
- Product_Master → stores reference information
- Calendar → controls time structure
This is called a Star Schema, the standard design used in analytics systems.
Common Beginner Mistakes to Avoid
Do not skip the calendar table and rely only on transaction dates.
Do not create multiple calendar tables.
Always connect the Calendar table to your main fact table using Date.
Try This Practice Exercise
Create a simple report:
- Add a Column Chart.
- Use:
- Axis → Year-Month (from Calendar)
- Values → Sales
You should now see how sales change over time.
You have just built your first time-based visual using a proper model.
How This Builds on Previous Days
Day 1 gave us the raw business transactions.
Day 2 ensured the data was clean and consistent.
Day 3 connected supporting information like products.
Today, Day 4 added the time structure needed for trend analysis.
You are gradually building a complete analytical system — not just learning features.
What Comes Next
Now that Power BI understands time, we can begin using Time Intelligence calculations like:
- Year-to-date performance
- Month-over-month comparisons
- Growth trends
These are the insights managers actually look for.
Conclusion
Today you added one of the most critical components of a professional Power BI model — a dedicated calendar table.
This step transforms your dataset from a collection of transactions into a system capable of answering real business questions over time.
You are no longer just visualizing data. You are modeling it.
If this helped clarify how time analysis works in Power BI, continue building along with the series. Share it with others learning data skills and stay connected as we move into calculations and performance comparisons next.
Leave a Reply