
Introduction
You have now learned:
Data cleaning
Data modeling
DAX calculations
Dashboard creation
Time Intelligence
Publishing
Interview concepts
Debugging scenarios
Now comes one of the most important interview skills.
Explaining your project confidently.
In many interviews, the interviewer may ask:
“Explain your Power BI project.”
Most beginners fail here.
Not because they lack skills.
But because they cannot explain their work properly.
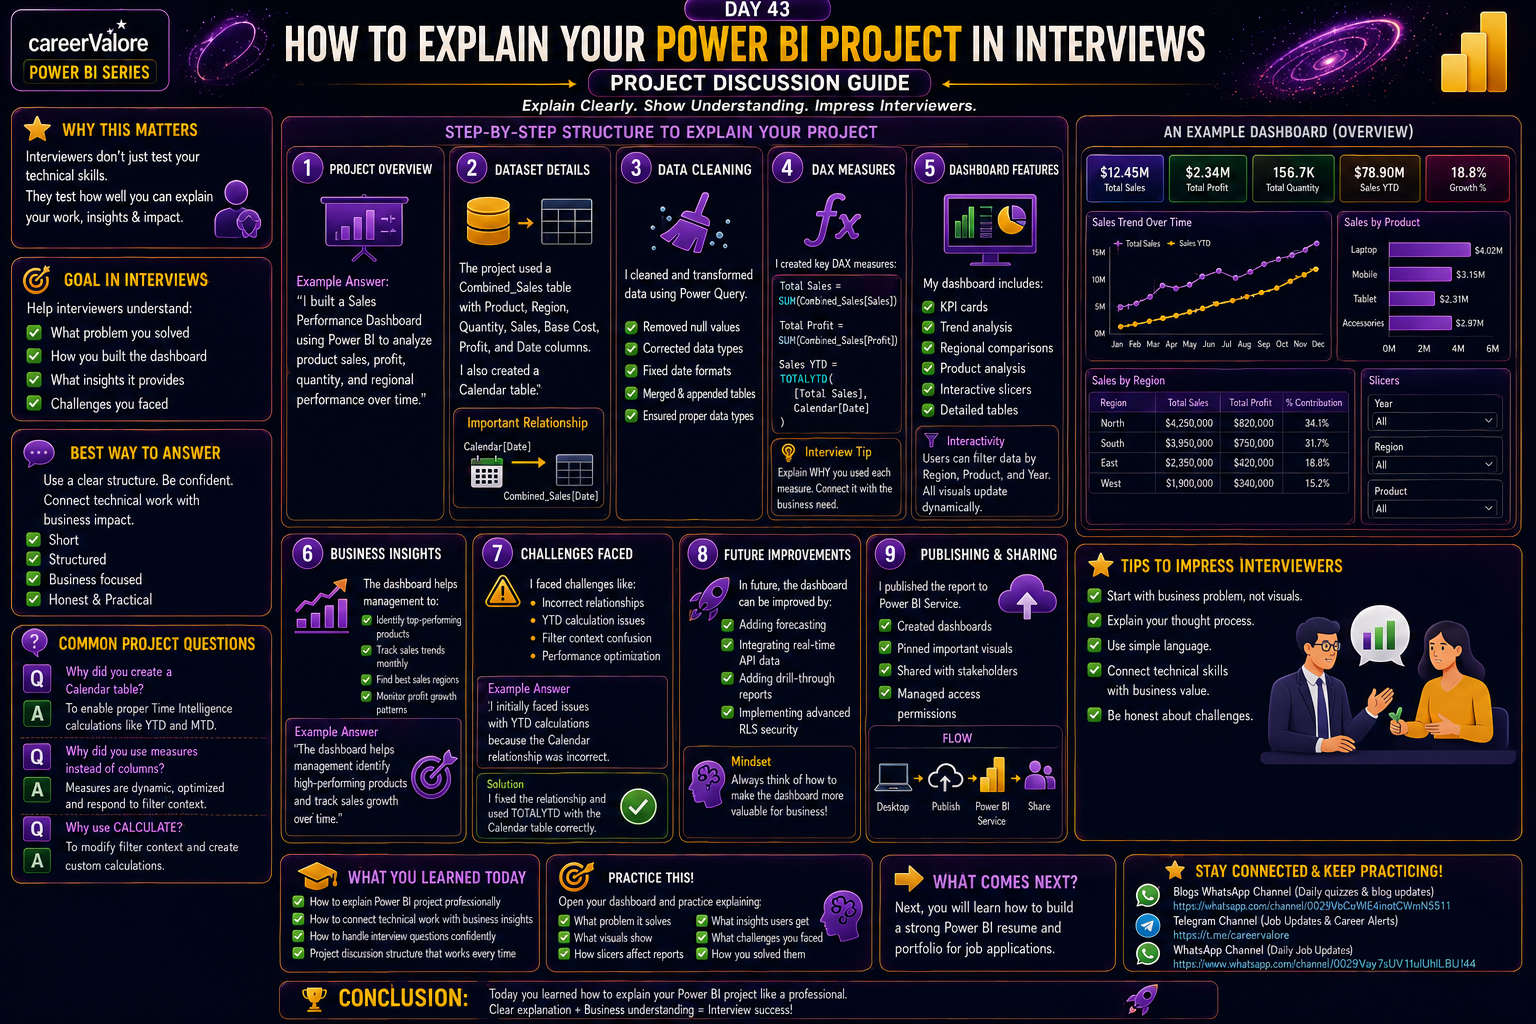
In Day 43, you will learn how to explain your Power BI dashboard professionally using your Combined_Sales and Calendar project.
What You Will Learn Today
You will learn how to explain your project in interviews
You will structure project explanations professionally
You will explain business insights clearly
You will answer common project discussion questions
Why This Skill Matters for Your Career
A good project explanation shows:
Technical understanding
Business understanding
Communication skills
This is extremely important during interviews.
Understanding the Goal
Interviewers do not expect memorized answers.
They want to understand:
What problem you solved
How you built the dashboard
What insights the dashboard provides
What challenges you faced
Step-by-Step Structure for Explaining Your Project
Use this order:
Project overview
Dataset details
Data cleaning
Data modeling
DAX calculations
Dashboard features
Business insights
Challenges faced
Future improvements
This creates a professional flow.
Step 1: Project Overview
Example Answer:
“I built a Sales Performance Dashboard using Power BI to analyze product sales, profit, quantity, and regional performance over time.”
Keep this short and clear.
Step 2: Explain the Dataset
Example Answer:
“The project used a Combined_Sales table containing Product, Region, Quantity, Sales, Base Cost, Profit, and Date columns.”
“I also created a Calendar table for Time Intelligence calculations.”
Important Point
Always mention:
Calendar table relationship.
Example:
Calendar[Date] → Combined_Sales[Date]
This shows modeling understanding.
Step 3: Explain Data Cleaning
Example Answer:
“I cleaned and transformed data using Power Query.”
Tasks included:
Removing null values
Correcting date formats
Appending and merging tables
Creating proper data types
Step 4: Explain DAX Measures
Mention important measures.
Example:
Total Sales = SUM(Combined_Sales[Sales])
Total Profit = SUM(Combined_Sales[Profit])
Sales YTD =TOTALYTD( [Total Sales], Calendar[Date])
Interview Tip
Do not just say:
“I created DAX.”
Explain why.
Example:
“I used TOTALYTD to analyze cumulative sales performance across time.”
Step 5: Explain Dashboard Features
Example Answer:
“My dashboard included:
KPI cards
Trend analysis
Regional comparisons
Product analysis
Interactive slicers
Detailed tables”
Mention interactivity.
Example:
“Users can filter data by Region, Product, and Year.”
Step 6: Explain Business Insights
This is very important.
Interviewers love business understanding.
Example Insights:
Top-performing products
Best sales region
Monthly sales trends
Profit growth patterns
Example Answer:
“The dashboard helps management identify high-performing products and track sales growth over time.”
Step 7: Explain Challenges Faced
This makes your explanation realistic.
Example Challenges:
Incorrect relationships
YTD calculation issues
Filter context confusion
Performance optimization
Example Answer:
“I initially faced issues with YTD calculations because the Calendar relationship was incorrect.”
Then explain solution.
Step 8: Explain Future Improvements
Example Answer:
“In future, the dashboard can be improved by adding:
Forecasting
Real-time API data
Drill-through reports
Advanced security”
This shows growth mindset.
Common Interview Questions About Projects
Question:
Why did you create a Calendar table?
Answer:
“To enable proper Time Intelligence calculations like YTD and MTD.”
Question:
Why did you use measures instead of columns?
Answer:
“Measures are dynamic and optimized for reporting.”
Question:
Why use CALCULATE?
Answer:
“To modify filter context for custom calculations.”
What You Learned Today
You learned how to explain:
Dataset
Modeling
DAX
Dashboard features
Business insights
Challenges
Future improvements
This is how real Power BI professionals discuss projects.
Try This Yourself
Open your dashboard and practice explaining:
What problem it solves
What visuals show
How slicers affect reports
What insights users can get
Practice speaking clearly and simply.
What Comes Next
Next, you will learn how to build a strong Power BI resume and portfolio for job applications.
Stay Connected and Keep Practicing
Blogs WhatsApp Channel (for daily quizzes and blog updates):
https://whatsapp.com/channel/0029VbCcWME4inotCWmN5511
Telegram Channel (Job Updates & Career Alerts):
https://t.me/careervalore
WhatsApp Channel (Daily Job Updates):
https://www.whatsapp.com/channel/0029Vay7sUV11ulUIhLBUI44
Conclusion
Today you learned one of the most important interview skills.
Not just building a dashboard.
But explaining it confidently like a professional.
Leave a Reply