
If you can read a grocery receipt or check the battery percentage on your phone, you already have the foundation to be a Data Analyst.
The tech industry wants you to believe that data analytics is a dark art reserved for math prodigies. Why? Because it keeps the salaries high and the jargon thick. But here is the reality: Data analytics is just structured common sense.
Whether you are a student, a career switcher, or someone who just wants to understand the “AI-driven” world we live in, this is your home base. Welcome to Day 1 of your transformation.
The Struggle: Why Does “Basics” Feel So Hard?
Most people quit data analytics in the first week because they get hit with “The Jargon Wall.” You try to look up a tutorial and see terms like Standard Deviation, Joins, and Data Warehousing. It feels like trying to learn to drive by building an engine from scratch. You don’t need to know how the engine works yet; you just need to know how to steer.
The Turning Point: What is Data Analytics, Really?
Data analytics isn’t about the tool (Excel or Python). It’s about the result.
At its core, Data Analytics is the process of taking “raw” information (the mess) and turning it into a “story” (the insight) so someone can make a better decision.
The 3-Step Logic
Every data project follows this simple flow:
- What happened? (Looking at the past)
- Why did it happen? (Finding the pattern)
- What should we do next? (The recommendation)
Real-World Example:
Imagine a retail store.
- The Data: 500 rows of sales from yesterday.
- The Analysis: You notice that every person who bought a Yoga Mat also bought Water Bottles.
- The Decision: You move the water bottles next to the yoga mats.
- The Result: Sales go up by 15%.
That is the power of a Data Analyst. You are the person who finds the hidden money.
The Step-by-Step Journey: The “Anatomy” of Data
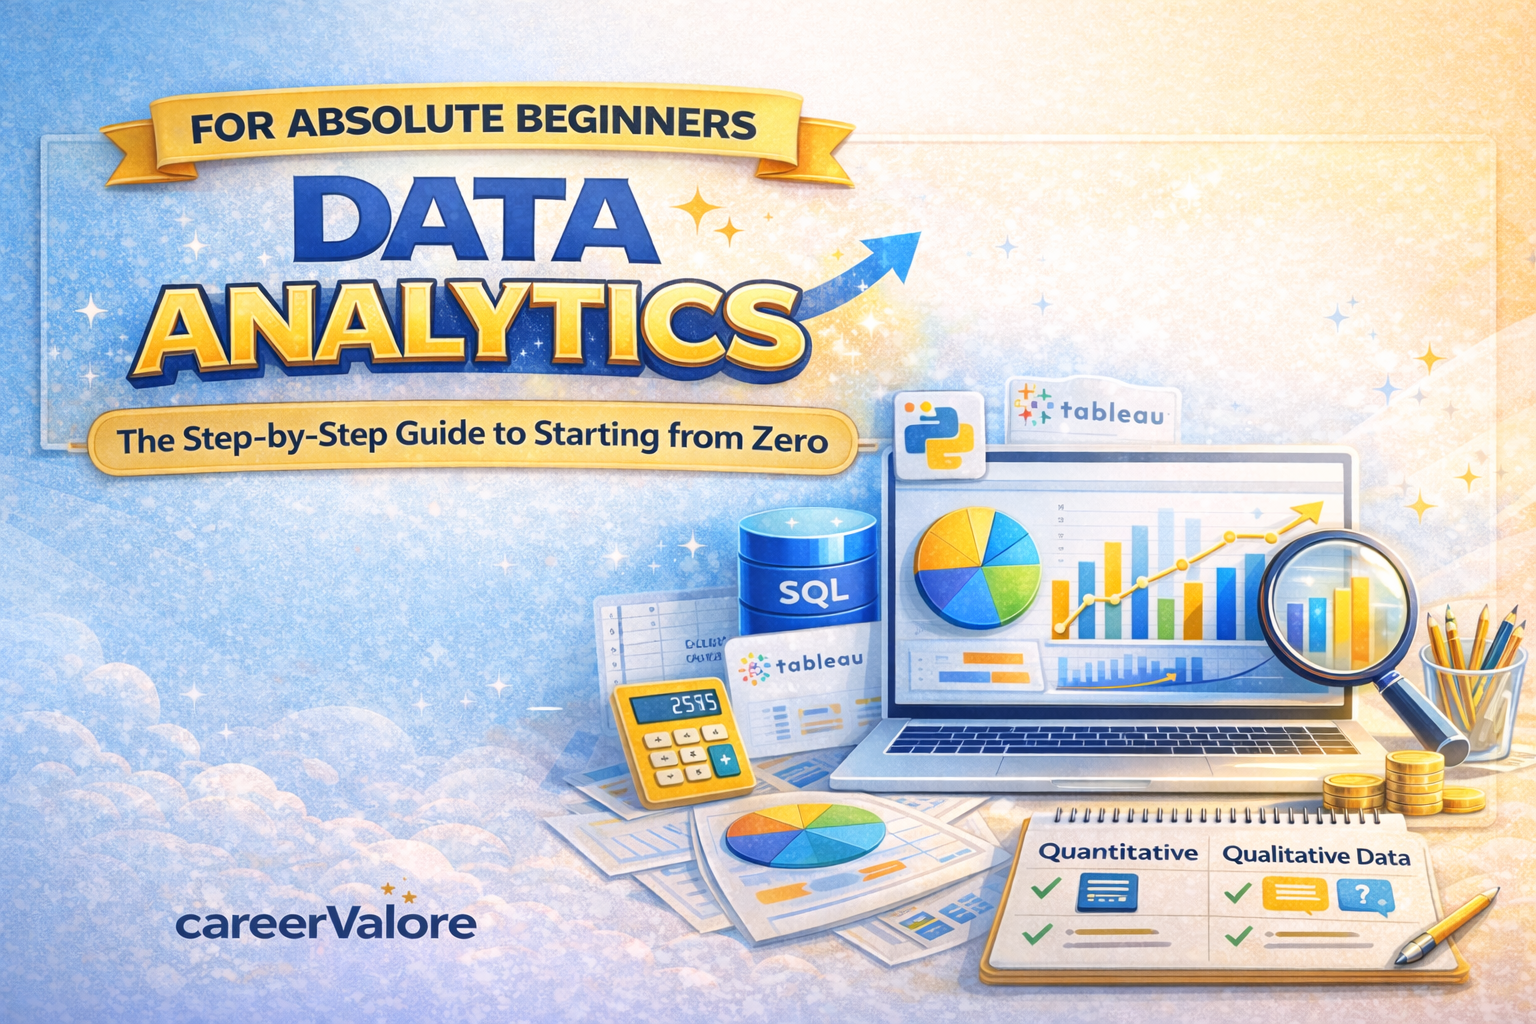
Before we open any software, you must understand the two main types of “ingredients” you will be working with. In the industry, we call these Quantitative and Qualitative data.
1. Quantitative Data (The Numbers)
Think of this as anything you can count or measure. It answers “How much?” or “How many?”
- Examples: Price of a product, temperature, number of likes on a post, the weight of a package.
- Pro-Tip: If you can do math on it (add, subtract, average), it’s quantitative.
2. Qualitative Data (The Descriptions)
This is about categories and characteristics. It answers “What kind?”
- Examples: Brand names, colors, customer reviews, job titles.
- Pro-Tip: You can’t “average” the color blue and the color red, but you can count how many people chose blue.
| Feature | Quantitative | Qualitative |
| Focus | Numbers & Stats | Categories & Descriptions |
| Tool | Calculator / Graphs | Surveys / Interviews |
| Example | $50.00 | “Excellent Quality” |
How Beginners Should Approach Learning
If you want to get hired or just get good, follow this “No-Burnout” path:
- Step 1: Master the Spreadsheet. (Excel or Google Sheets). This is where 80% of the world’s data lives. If you know
SUM,AVERAGE, andVLOOKUP, you are already ahead of most people. - Step 2: Learn to Ask Questions. An analyst’s best tool isn’t a computer; it’s the word “Why?”
- Step 3: Visual Communication. Learn how to make a chart that doesn’t look like a 1990s PowerPoint slide.
- Step 4: The Language of Databases (SQL). This sounds scary, but it’s just a way to ask a big list of data specific questions.
Your First Lesson: The “Clean” Mindset
The biggest secret in the industry? Data is always messy. In a perfect world, everyone enters their name and email correctly. In the real world, someone writes “John Doe,” someone else writes “john doe,” and another person leaves it blank.
An analyst spends a lot of time “cleaning”—which just means making things consistent so the computer can understand them.
Your Daily Mission (Action Step)
You cannot learn this by just reading. You have to touch the data.
The Task: 1. Go to your email inbox.
2. Count how many emails you received today (Quantitative).
3. Categorize them into three groups: “Work/School,” “Promotions,” and “Personal” (Qualitative).
4. Calculate what percentage of your day was spent on “Promotions.”
That’s it. You just performed a “Category Analysis” of your digital life.
Leave a Reply