
Introduction
So far, you have learned how to calculate totals, apply filters, and compare contributions.
But in real business scenarios, one question always comes first:
How is performance changing over time?
Managers don’t just want total sales.
They want:
Sales this month
Sales this year
Growth compared to previous periods
This is called Time Intelligence.
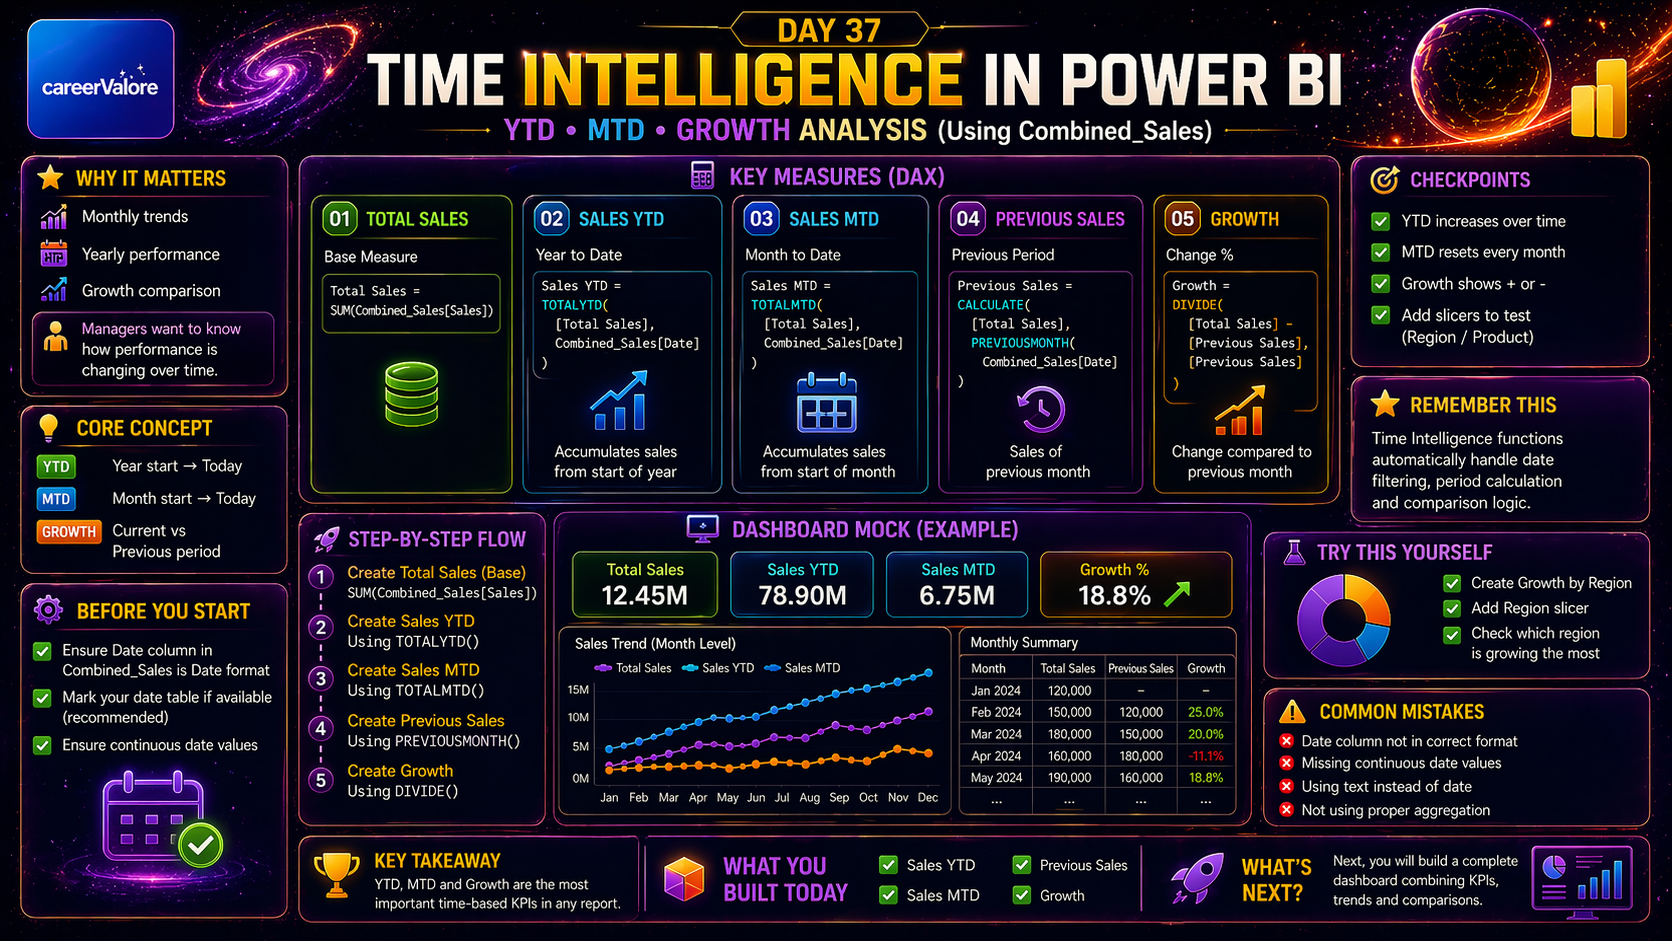
In Day 37, you will correctly implement YTD, MTD, and Growth using your Combined_Sales table along with the Calendar table.
What You Will Learn Today
You will understand Time Intelligence
You will correctly use a Calendar table
You will create Year-to-Date (YTD) Sales
You will create Month-to-Date (MTD) Sales
You will calculate Growth
You will fix common mistakes in time analysis
Why This Skill Matters for Your Career
Time-based analysis is one of the most important skills in Power BI.
Almost every dashboard includes:
Monthly trends
Yearly performance
Growth comparison
Without a proper date model, these calculations fail.
Understanding the Concept in Simple Terms
YTD → Sales from start of year till current date
MTD → Sales from start of month till current date
Growth → Change compared to previous period
How This Connects to Previous Days
Day 34 → You created measures
Day 35 → You controlled filters
Day 36 → You calculated contribution
Today → You analyze performance over time correctly
Important Requirement Before Starting
You already have a Calendar table.
Now ensure it is properly connected.
Go to Model View:
Create relationship:
Calendar[Date] → Combined_Sales[Date]
This step is mandatory.
Without this, Time Intelligence will not work correctly.
Step-by-Step: Use Calendar Table in Visuals
When creating visuals:
Do NOT use:
Combined_Sales Month Name
Instead use:
Calendar Month
Calendar Date
This ensures correct time filtering.
Step-by-Step: Create Total Sales Measure
Total Sales = SUM(Combined_Sales[Sales])
Step-by-Step: Create YTD Sales
Sales YTD = TOTALYTD( [Total Sales], Calendar[Date])
Test Checkpoint
Create a table:
Add:
Calendar Month
Sales YTD
Values should increase over time.
Step-by-Step: Create MTD Sales
Sales MTD = TOTALMTD( [Total Sales], Calendar[Date])
Test Checkpoint
Values should reset at the start of each month.
Step-by-Step: Create Previous Month Sales
Previous Sales = CALCULATE( [Total Sales], PREVIOUSMONTH(Calendar[Date]))
Step-by-Step: Create Growth
Growth = DIVIDE( [Total Sales] - [Previous Sales], [Previous Sales])
Test Checkpoint
Create a table:
Add:
Calendar Month
Total Sales
Previous Sales
Growth
Now:
Values should change month-wise
Previous Sales should appear correctly
Growth should show increase or decrease
Step-by-Step: Visualize Time Analysis
Create Line Chart:
Axis → Calendar Date (Month level)
Values → Total Sales
Add:
Sales YTD
Sales MTD
You should now see:
Trend line
Monthly variation
Accumulated growth
Important Understanding
Time Intelligence works only when:
A proper date table is used
A relationship is created
Calendar table is used in visuals
Try This Yourself
Add a slicer:
Calendar Year or Month
Check:
Do YTD and Growth update correctly
If yes, your model is correct
Common Mistakes to Avoid
Using Combined_Sales Month instead of Calendar
Not creating relationship
Using text instead of date
Expecting results without proper date model
What You Built Today
You created:
Sales YTD
Sales MTD
Previous Sales
Growth
And fixed your data model using Calendar
What Comes Next
Next, you will bring everything together and start building a complete professional dashboard.
Stay Connected and Keep Practicing
Blogs WhatsApp Channel (for daily quizzes and blog updates):
https://whatsapp.com/channel/0029VbCcWME4inotCWmN5511
Telegram Channel (Job Updates & Career Alerts):
https://t.me/careervalore
WhatsApp Channel (Daily Job Updates):
https://www.whatsapp.com/channel/0029Vay7sUV11ulUIhLBUI44
Conclusion
Today you corrected one of the most important concepts in Power BI.
By properly using the Calendar table and connecting it with Combined_Sales, your Time Intelligence calculations now work correctly and produce meaningful insights.
Leave a Reply