
Introduction
In Day 35, you learned how to use CALCULATE to apply filters inside a measure.
That helped you control what data is included in calculations.
But there is another problem.
Sometimes you don’t want to apply filters.
You want to ignore them.
For example:
You are viewing Sales by Product
Each product shows its sales
But you also want to know:
What percentage of total sales each product contributes
If you don’t remove filters, you will always get incorrect results like 100%.
In Day 36, you will learn how to remove filters using ALL and calculate real comparisons.
What You Will Learn Today
You will understand ALL function
You will remove filters from calculations
You will calculate % Contribution
You will build comparison metrics
Why This Skill Matters for Your Career
In real dashboards:
Managers don’t just want totals
They want:
Contribution
Market share
Performance comparison
ALL is required for almost every percentage calculation in Power BI.
Understanding the Concept in Simple Terms
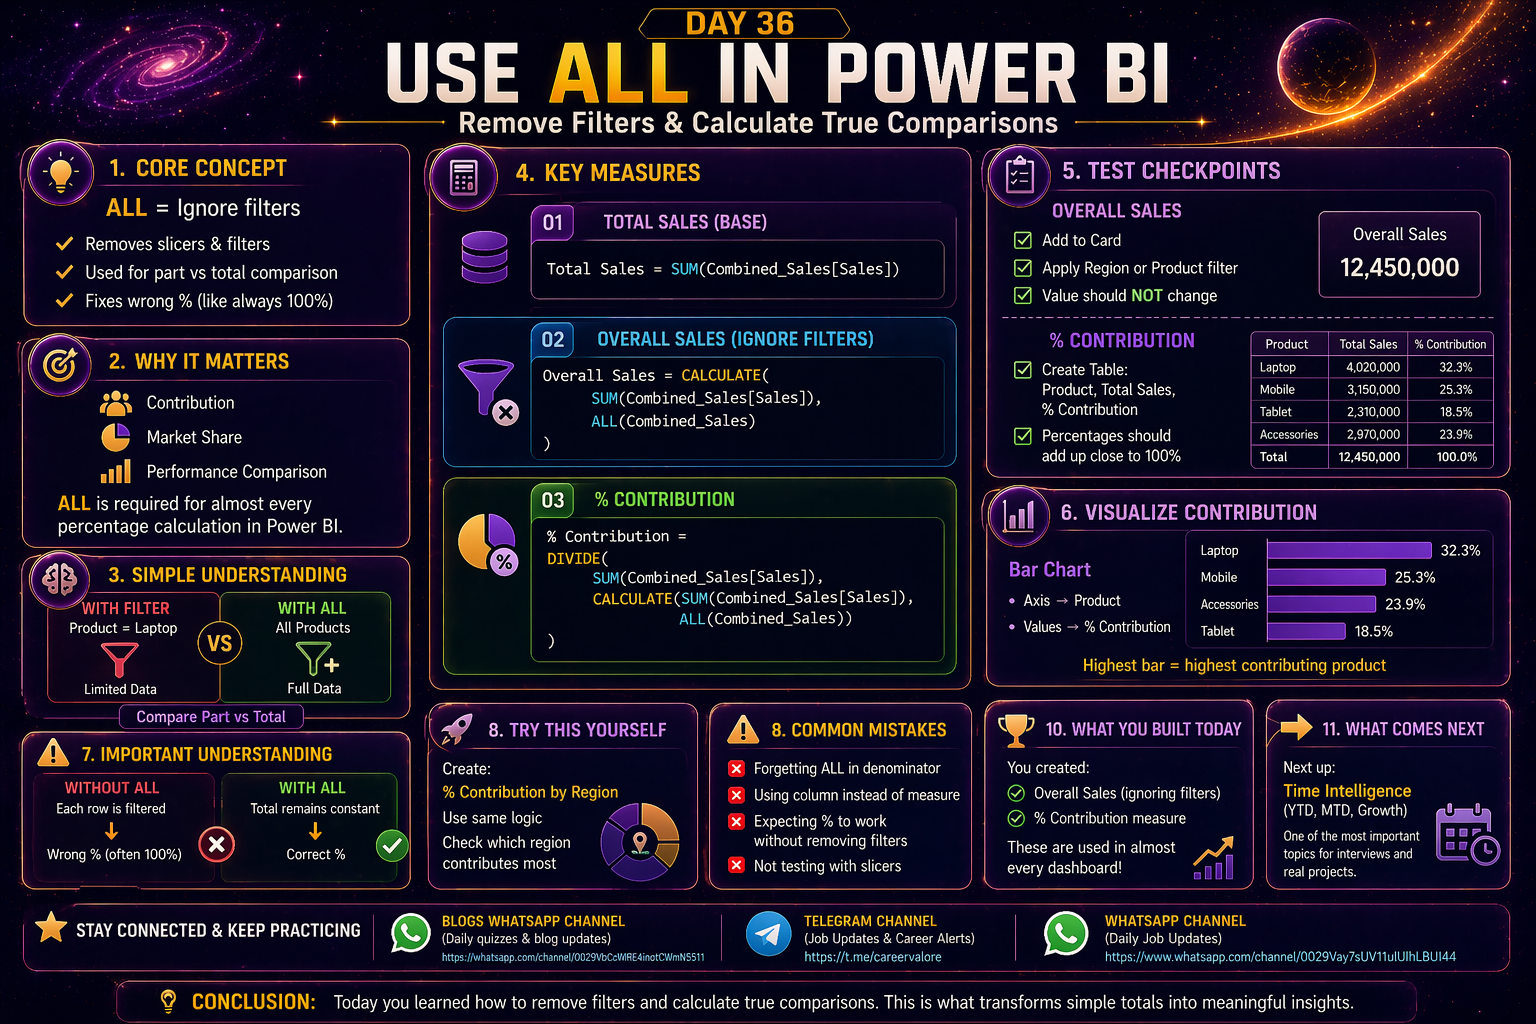
ALL = Ignore filters
Example:
If Product = Laptop is selected
ALL will ignore that and consider all products
So:
You can compare part vs total
How This Connects to Previous Days
Day 34 → You created basic measures
Day 35 → You applied filters using CALCULATE
Today → You remove filters to calculate true comparisons
Step-by-Step: Create Total Sales Measure (Base)
If not already created:
Right-click Combined_Sales → New Measure
Total Sales = SUM(Combined_Sales[Sales])
Step-by-Step: Create Overall Sales (Ignoring Filters)
Overall Sales = CALCULATE( SUM(Combined_Sales[Sales]), ALL(Combined_Sales))
Test Checkpoint
Add to Card
Apply Region or Product filter
✔ Value should NOT change
This confirms filters are removed
Step-by-Step: Create % Contribution Measure
% Contribution = DIVIDE( SUM(Combined_Sales[Sales]), CALCULATE(SUM(Combined_Sales[Sales]), ALL(Combined_Sales)))
Test Checkpoint
Create Table:
Add:
Product
Total Sales
% Contribution
✔ Percentages should add up close to 100%
What This Means
You are comparing:
Individual Product Sales vs Total Sales
Step-by-Step: Visualize Contribution
Create Bar Chart:
Axis → Product
Values → % Contribution
Test Checkpoint
Highest bar = highest contributing product
Important Understanding
Without ALL:
Each row is filtered → gives wrong %
With ALL:
Total remains constant → gives correct %
Try This Yourself
Create:
% Contribution by Region
Use same logic
Check:
Which region contributes most
Common Mistakes to Avoid
Forgetting ALL in denominator
Using column instead of measure
Expecting % to work without removing filters
Not testing with slicers
What You Built Today
You created:
Overall Sales (ignoring filters)
% Contribution measure
These are used in almost every dashboard
What Comes Next
Next, you will learn Time Intelligence (YTD, MTD, Growth).
This is one of the most important topics for interviews and real projects.
Stay Connected and Keep Practicing
Blogs WhatsApp Channel (for daily quizzes and blog updates):
https://whatsapp.com/channel/0029VbCcWME4inotCWmN5511
Telegram Channel (Job Updates & Career Alerts):
https://t.me/careervalore
WhatsApp Channel (Daily Job Updates):
https://www.whatsapp.com/channel/0029Vay7sUV11ulUIhLBUI44
Conclusion
Today you learned how to remove filters and calculate true comparisons.
This is what transforms simple totals into meaningful insights.
Leave a Reply