
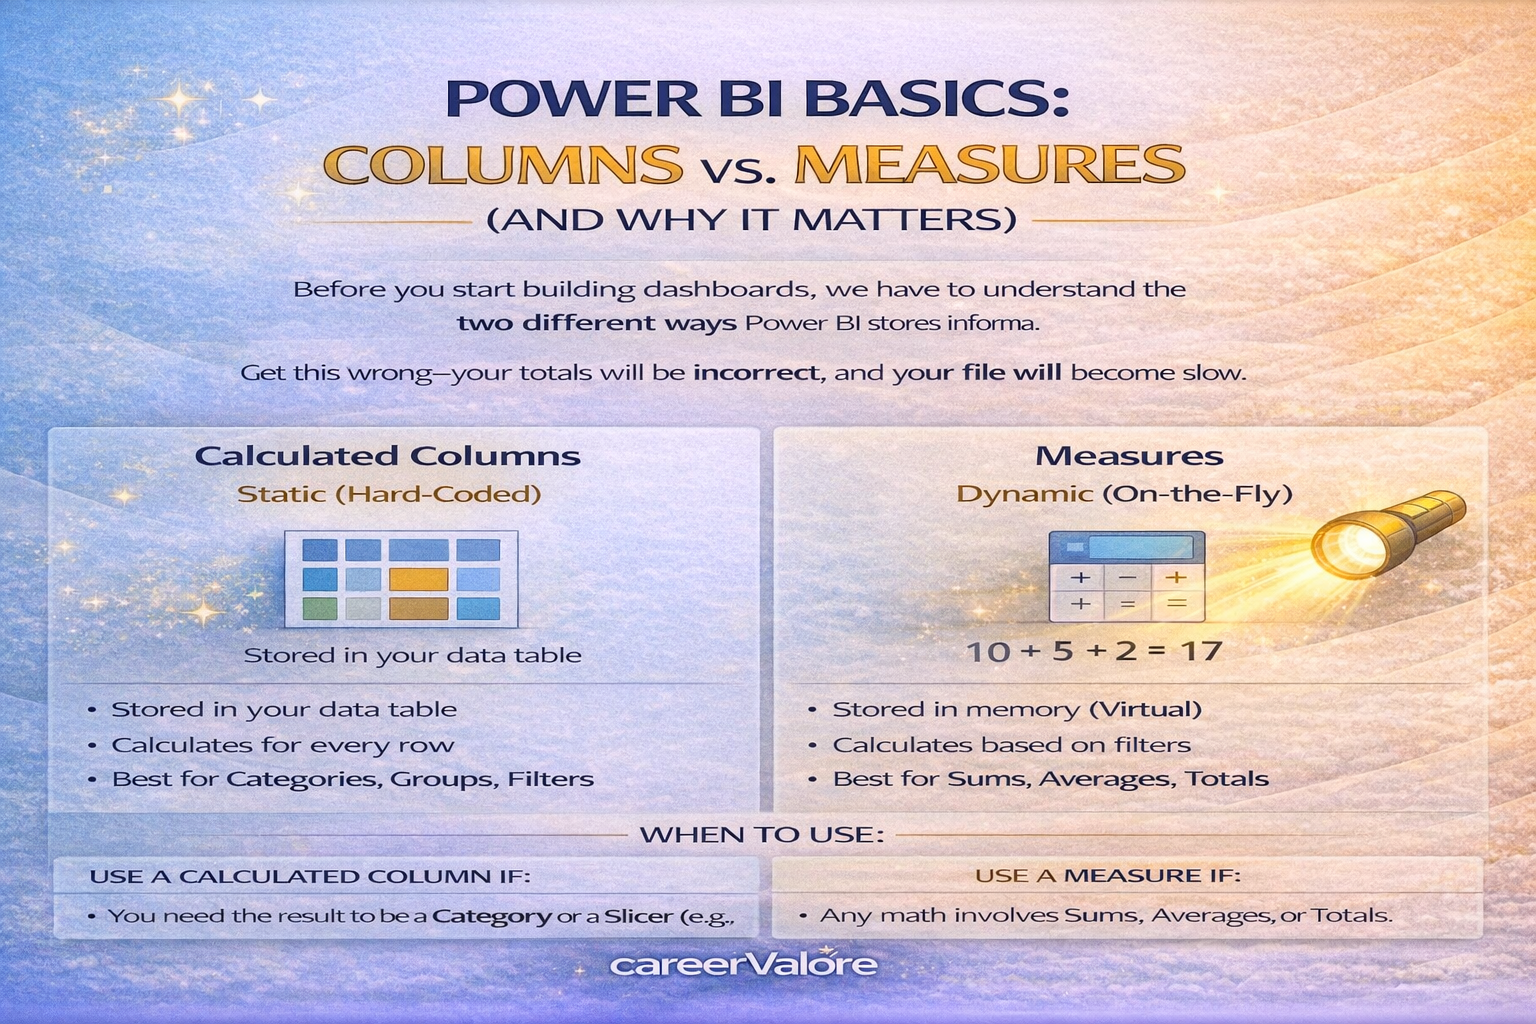
Before we start building dashboards, we have to understand the two different ways Power BI stores information. If you get this wrong, your totals will be incorrect, and your file will become slow.
In this lesson, we will cover the fundamental difference between Calculated Columns and Measures, why we use one over the other, and how to build them step-by-step.
The Concept: Static vs. Dynamic
- Calculated Columns (Static): These are like writing on a piece of paper. Once you write it, it stays there. It lives in your data table and takes up memory.
- Measures (Dynamic): These are like a calculator. They don’t exist until you hit the “=” button. They calculate on the fly based on what you click in your report.
The Data: Build Your Lab Environment
To follow this guide, open Excel and create this simple Sales table. This is our “Raw Material.”
Table: StoreData
| Product | UnitsSold | PricePerUnit |
| :— | :— | :— |
| Camera | 10 | 500 |
| Lens | 5 | 300 |
| Tripod | 2 | 100 |
Action Step 1: Creating a Calculated Column (Row Level)
A Calculated Column is best for “Row-Level” math—where you need an answer for every single line.
The Goal: Calculate the “Gross Sales” for every individual row.
- Import: Load the
StoreDatatable into Power BI. - Navigate: Click the Table View icon on the far left.
- Action: Click New Column in the top Ribbon.
- The Step: Type this formula:$$Gross Sales = StoreData[UnitsSold] * StoreData[PricePerUnit]$$
- Observation: You now see a new physical column. For the “Camera” row, it shows 5000. This number is now “hard-coded” into your data model.
Action Step 2: Creating a Measure (Aggregate Level)
A Measure is best for “Totals.” It doesn’t look at one row; it looks at the whole table (or whatever you’ve filtered).
The Goal: Calculate the “Total Company Revenue.”
- Navigate: Click the Report View icon (top icon on the left).
- Action: Right-click the
StoreDatatable in the Data Pane and select New Measure. - The Step: Type this formula:$$Total Revenue = SUM(StoreData[Gross Sales])$$
- Observation: Look at the Data Pane. You see a calculator icon next to “Total Revenue.” Note that no new column appeared in your data table. —
Action Step 3: Testing the Basics
- Drag a Card visual onto your canvas.
- Drag your Total Revenue measure into it.
- Result: You see $6,700.
- Now, create a Slicer and add the Product column to it.
- Click “Lens”.
- The Magic: The Card changes to $1,500. This proves the Measure is “Dynamic”—it only calculates the rows that are currently “visible” through your filter.
Summary Checklist
- Use a Calculated Column if you need the result to be a category or a slicer (e.g., “High Sales” vs “Low Sales”).
- Use a Measure for any math that involves Sums, Averages, or Totals.
- Basics Rule: Measures keep your file size small; Columns make it bigger.
Leave a Reply