
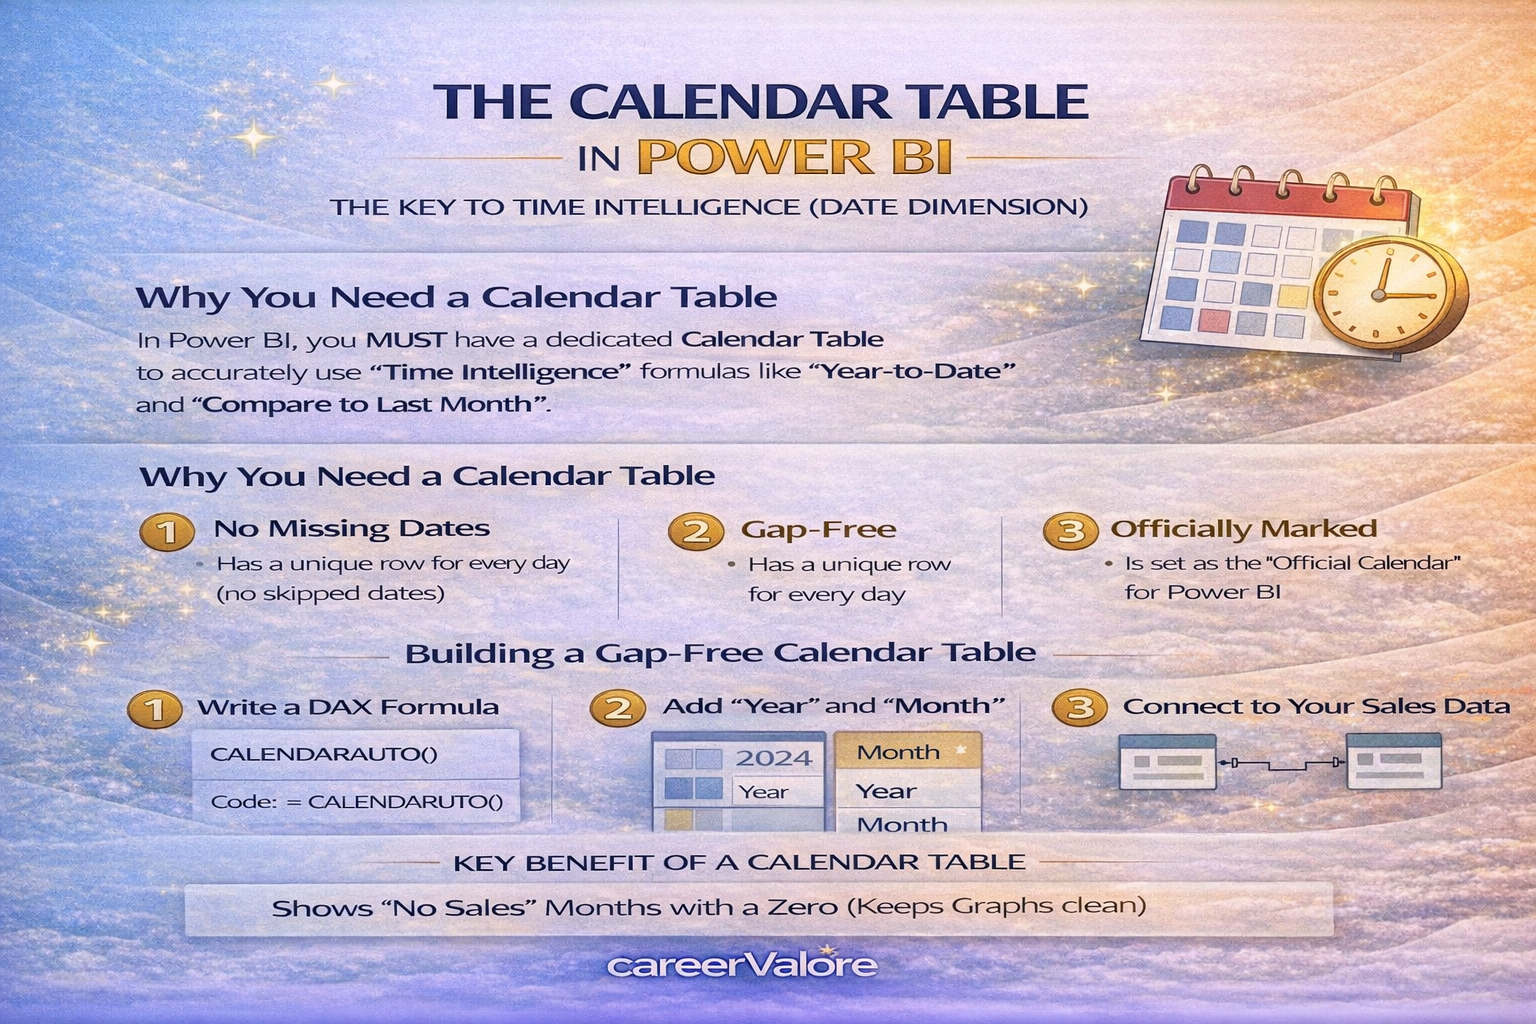
Power BI’s time-travel formulas (DAX) are very picky. For them to work, they need a table that:
- Has no missing dates (even if you didn’t sell anything on Christmas, the date must exist in the table).
- Has a unique row for every single day.
- Is marked as the “Official Calendar” for the model.
Without this, your “Last Month Sales” formula will often return blank or incorrect numbers.
The Data: Create Your “Sales” Table
To see why we need a calendar, let’s look at a typical “broken” dataset. Create this in Excel and import it.
Table: TransactionData
| Date | Item | Amount |
| :— | :— | :— |
| 1/01/2024 | Laptop | 1000 |
| 1/02/2024 | Mouse | 50 |
| 1/05/2024 | Keyboard | 100 |
Notice the gap! There is no data for Jan 3rd or Jan 4th. This “gap” is what breaks Power BI formulas.
Action Step: Building the “Auto-Calendar”
We will use a simple DAX formula to create a perfect, gap-free calendar that automatically knows the start and end of your data.
1. Create the Table
- In Power BI, go to the Table View (middle icon on the left).
- In the top ribbon, click New Table (not New Column).
- Type this exact formula:$$MasterCalendar = CALENDARAUTO()$$
- Observation: Power BI looks at your
TransactionData, finds the earliest date and the latest date, and creates a single column of every single day in between.
2. Add “Helper” Columns
A list of dates is boring. We want to be able to filter by “Year” or “Month Name.”
- With your new
MasterCalendartable selected, click New Column. - Type:
Year = YEAR(MasterCalendar[Date]) - Click New Column again.
- Type:
MonthName = FORMAT(MasterCalendar[Date], "MMMM")
3. Connect the “Bridge” (The Model)
This is the step most beginners forget.
- Go to the Model View (bottom icon on the left).
- Drag the
Datecolumn from your MasterCalendar table onto theDatecolumn in your TransactionData table. - The Result: You now have a 1-to-many relationship. Your calendar is now the “Boss” of time.
Action Step 2: Testing “Time Intelligence”
Now let’s see why we did all that work.
- Go to Report View.
- Create a Slicer and use
MasterCalendar[Year]. - Create a Bar Chart.
- Use
MasterCalendar[MonthName]for the X-axis. - Use
TransactionData[Amount]for the Y-axis.
The Benefit: Even if you had no sales in February, the bar chart will still show “February” on the axis with a zero. This keeps your reports looking professional and consistent.
Summary Checklist
- CALENDARAUTO(): The easiest way to create a date table.
- No Gaps: Every day from Jan 1st to Dec 31st must be present.
- One Truth: Always use the Year/Month from the Calendar Table in your charts, never from the raw sales table.
Leave a Reply